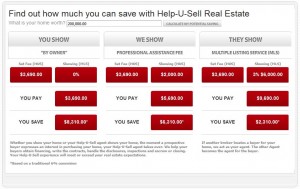
We’re about to unveil a new version of the Seller Savings Comparison chart for the broker websites. The new version will allow you to personalize the chart to show your set fee, and your sellers can enter their home’s value and calculate their potential savings.
We have some design work to complete before we recommend adding the page to your site, but here is a preview of the basic structure. In the example, the seller has entered $200,000 as his home’s value, and the broker has a set fee of $3,690 and a showing fee of $2,000.

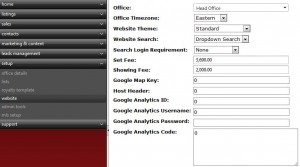
You can populate the chart with your set fee and showing fee by logging into your OMS, clicking on “Setup” in the drop-down menu and selecting “website” from the submenu. You will add in your set fee and showing fee as shown in the example below.

If you have any questions about how to use the chart or how to fill it in with your set fee and showing fee, please contact us. The chart will be ready for you to publish soon. We will keep you updated.
